Our lab focusses on how metabolic changes are involved in human diseases and ageing, and how we can manipulate cell metabolism and cell signalling to come up with novel therapeutic strategies.
Some of our recent (and partly still ongoing) research projects are highlighted below:
ACTIVATING THE NRF2 TRANSCRIPTION FACTOR
Many years ago I was greatly inspired by a
research paper by Gerald Shulman’s group at Yale. His lab developed a liver-selective mitochondrial uncoupler drug. His group developed a prodrug that is normally inactive, but can be converted to an active uncoupler by drug-metabolising cytochrome P450 enzymes, which are exclusively expressed in the liver. As a consequence, the active uncoupler only accumulates in liver tissue, thus avoiding on-target and off-target side effects in other tissues.
Most new ideas are inspired by other ideas. Hence, being fascinated by the uncoupler prodrug idea, I tried to come up with related research questions. For instance, one project that Ying Yee, an amazing UROPS student in our lab, conducted several ago was to develop a novel prodrug delivery system to kill tumor cells.
A major problem in conventional cancer therapy is dose-limiting drug toxicity. Although most anti-cancer drugs have some selectivity towards cancer cells, this selectivity is usually only partial and they commonly also affect normal cells to some degree. As a result, the doses of anti-cancer drugs that can be given to patients are often limited.
In Ying Yee’s project, we utilised 2-methyl-antimycin A as the prodrug of the cytotoxic complex III inhibitor antimycin A. The end goal of her project was to engineer a cytochrome P450 (CYP450) enzyme that can metabolically activate 2-methyl-antimycin A. The engineered enzyme could potentially be targeted to tumours via cell-based or adeno-associated virus (AAV) delivery systems.
Before trying to engineer such an enzyme, we had to ensure that 2-methyl-antimycin A is not cytotoxic before its conversion, as well as that endogenous human CYP450 enzymes in the liver do not activate 2-methyl-antimycin Ying Yee was able to confirm both of these prerequisites. She also found that expression of CYP450 enzymes in non-hepatic cells is in principle sufficient to mediate prodrug activation, without the need of cotransfecting CYP450 reductases, which appear to be expressed at sufficient levels in non-hepatic cells.
Sadly, engineering a CYP450 enzyme that could activate 2-methyl-antimycin A proved more difficult than expected. And when Ying Yee’s UROPS project ended, the project stopped there, too.
However, another attempt to establish a cytochrome P450-mediated prodrug system proved more successful, and this is the subject (in part) of our most recent publication.
In the project, Mei Ying, who used to be a PhD student in our lab and now is a postdoc at Dana-Farber Cancer Institute, tried to find new prodrugs that could be activated in a liver-selective manner.
In our study, we focussed on the transcription factor NRF2 (short for Nuclear factor-erythroid 2-Related Factor 2). NRF2 has been shown to have beneficial effects in various human diseases and conditions. These include fatty liver disease and its more advanced form, nonalcoholic hepatosteatitis (NASH), which in addition to fat accumulation is characterised by inflammation of liver tissue.
Fatty liver disease and NASH are not only extremely common, they are also worrying because they often progress to liver cirrhosis, liver failure and liver cancer. Furthermore, they are often associated with insulin resistance.
NRF2 functions to induce the expression (via transcriptional activation) of different target gene families, including drug-metabolising enzymes, anti-inflammatory factors as well as enzymes involved in scavenging or detoxifying reactive oxygen species. Both anti-inflammatory and antioxidant mechanisms are likely to contribute to the beneficial effects of NRF2 activation in NASH. As such, many research groups and pharmaceutical companies have been trying to find new activators of NRF2.
Indeed, numerous NRF2 activators have been identified and developed, most of which work by inhibiting its negative regulator, the E3 ubiquitin ligase KEAP1.
Yet, the therapeutic strategy of NRF2 activation has proved difficult to translate into the clinic. This is because activating NRF2 can also have unwanted negative consequences. As we wrote in our original paper:
“… NRF2 activation is known to promote tumorigenesis as well as mediate chemoresistance. Inactivating mutations in KEAP1 or activating mutations in NRF2 are frequently found in a number of cancers, including cancers of the lung, gallbladder, and liver. While generally cytoprotective, NRF2 activators can also exert important other adverse effects. For instance, NRF2 activation has been reported to promote hypertension in diabetic mice via the transcriptional induction of angiotensin and angiotensin-converting enzyme in renal proximal tubule cells. Nrf2 activation in regulatory T cells has been shown to promote regulatory T cell loss and to induce an autoinflammatory phenotype in mice. NRF2 has also been reported to play an important role in regulating hematopoietic stem cell quiescence. In addition, electrophilic NRF2 activators are also likely to have off-target effects by reacting with other target proteins with reactive cysteine residues.”
What these studies suggest is that long-term treatment with NRF2 inducers can promote tumor formation, as well as lead to unwanted side effects in different tissues. Indeed, a
clinical trial for the treatment of patients with type 2 diabetes and chronic kidney disease with the Nrf2 activator drug bardoxolone methyl was interrupted prematurely because of an increased incidence of adverse cardiovascular events and death in trial participants.
As such, the challenges associated with developing NRF2 activators are similar to mitochondrial uncouplers, which also have great potential in the treatment of obesity and fatty liver disease, but which at the same time can cause toxic side effects.
Hence, in our project, Mei Ying set out to identify compounds that are inactive in inducing NRF2 activation on their own but that can be activated by hepatic CYP450 enzymes. And it was a very exciting moment when she succeeded to find a number of such compounds!
Specifically, as shown in the figure below, Mei Ying found that three compounds, 3-methylphenol, 2-tert-butylphenol and 3-tert-butylphenol, induced the expression of NRF2 after preincubation with rat liver microsomes (i.e. liver endoplasmic reticulum particles that contain CYP450 enzymes). These compounds were inactive without prior activation (not shown in the figure). Moreover, the prodrugs were only activated when the CYP450 co-substrate NADPH was added during the preincubation with liver microsomes.
The three prodrugs are converted into the active compounds 4-methylcatechol (4-MC) and tert-butylhydroquinone (tBHQ), respectively. As expected, the figure also shows that 4-MC and tBHQ themselves activate NRF2 without requiring NADPH-dependent preactivation.
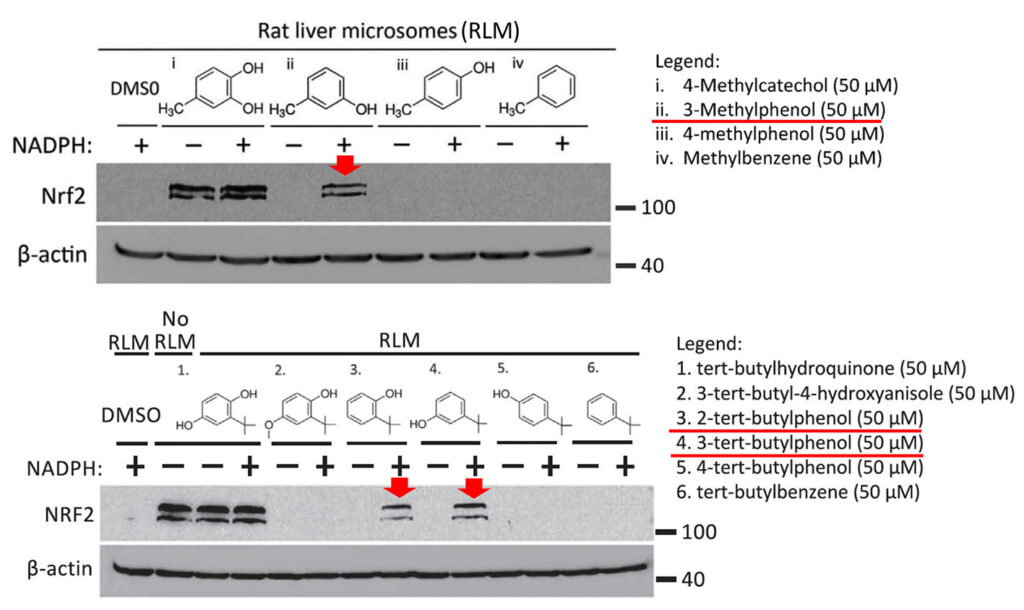
In the shown experiments, HEK293T cells were treated for 4 h with the known NRF2 activator 4-methylcatechol (top panel (i)), or the indicated prodrug analogs of 4-methylcatechol (ii, iii, and iv). In the bottom panel, cells were treated with another NRF2 activator, tert-butylhydroquinone (1) or its prodrug candidates. Prior to the cell treatment, all drugs were preincubated with rat liver microsomes (containing CYP450 enzymes) in the presence or absence of the CYP450 co-substrate NADPH. The results suggest that the prodrug candidates indicated with the red arrows were converted to their active metabolites.
Cytochrome P450 enzymes utilise oxygen as a co-substrate. Given that our experiments were conducted at an atmospheric oxygen concentration of 21%, one valid question is whether the CYP450-mediated prodrug activation also occurs under physiological conditions in vivo, where the oxygen concentrations are much lower. For instance, the physiological oxygen concentration in the liver is only around 4%.
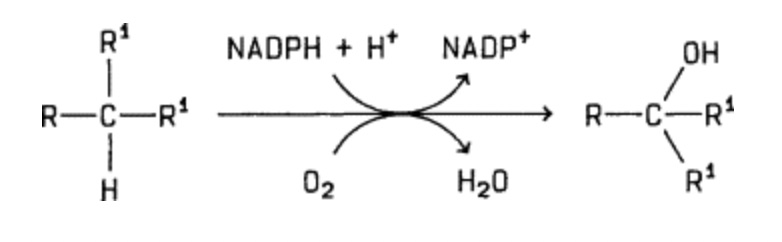
General reaction of CYP450-catalyzed hydroxylases to catalyse substrate hydroxylation
While we did not address this question in our study, it appears likely that the reaction does happen in vivo, given that CYP450 enzymes normally operate under these conditions. Indeed, CYP450 enzymes are known to have a rather high affinity for oxygen.
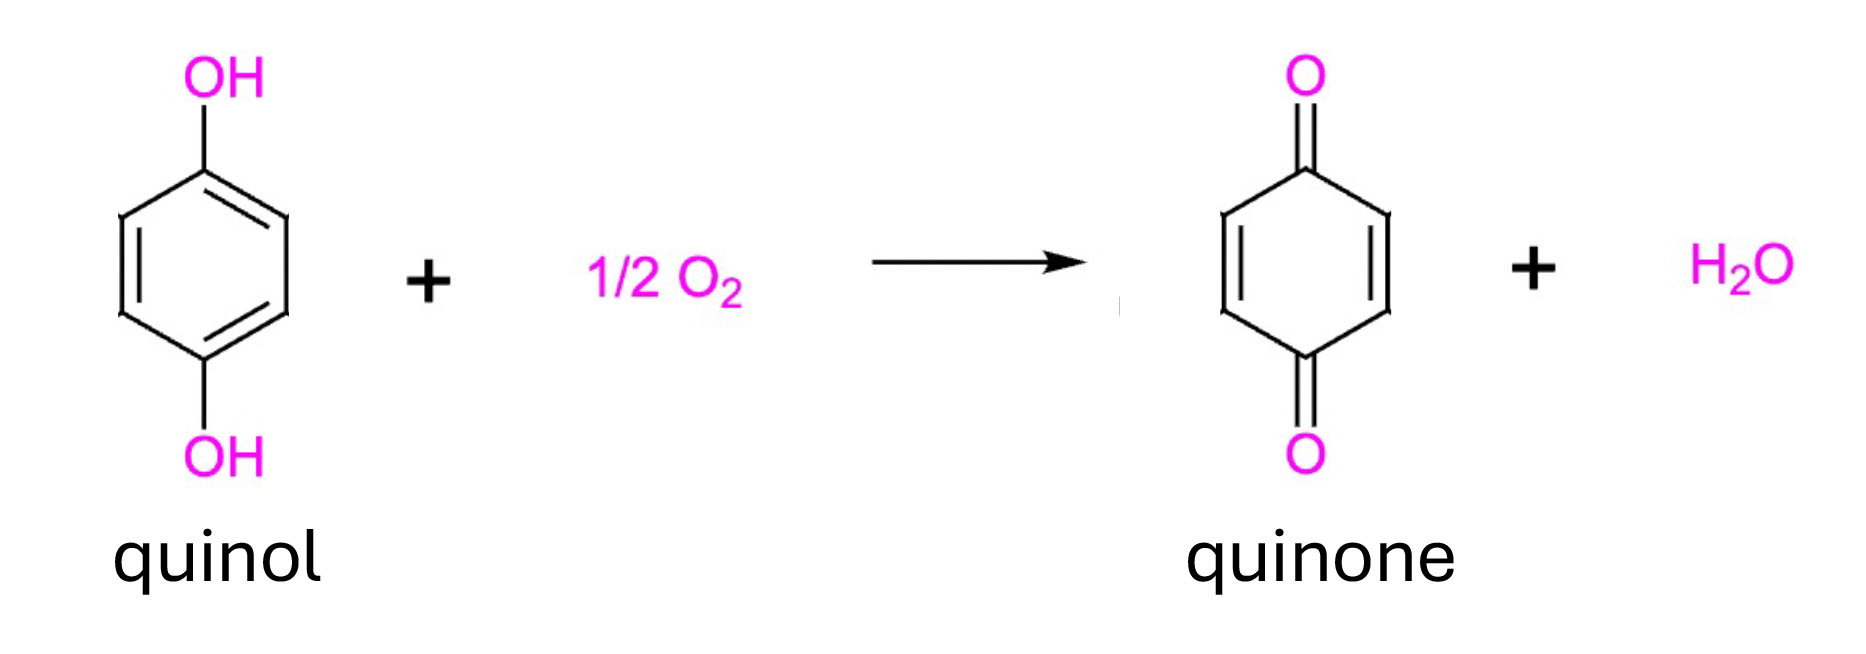
However, more significantly, upon activation of our prodrugs via hydroxylation, the activated quinol compounds (4-methylcatechol (4-MC) and tert-butylhydroperoxide (tBHQ)) need to undergo a further autooxidation to be able to bind to and inhibit the E3 ubiquitin ligase (i.e. KEAP1) and induce NRF2 expression. This autooxidation gives rise to reactive quinones, and importantly, is also oxygen-dependent.
Oxygen-dependent autooxidation of quinols
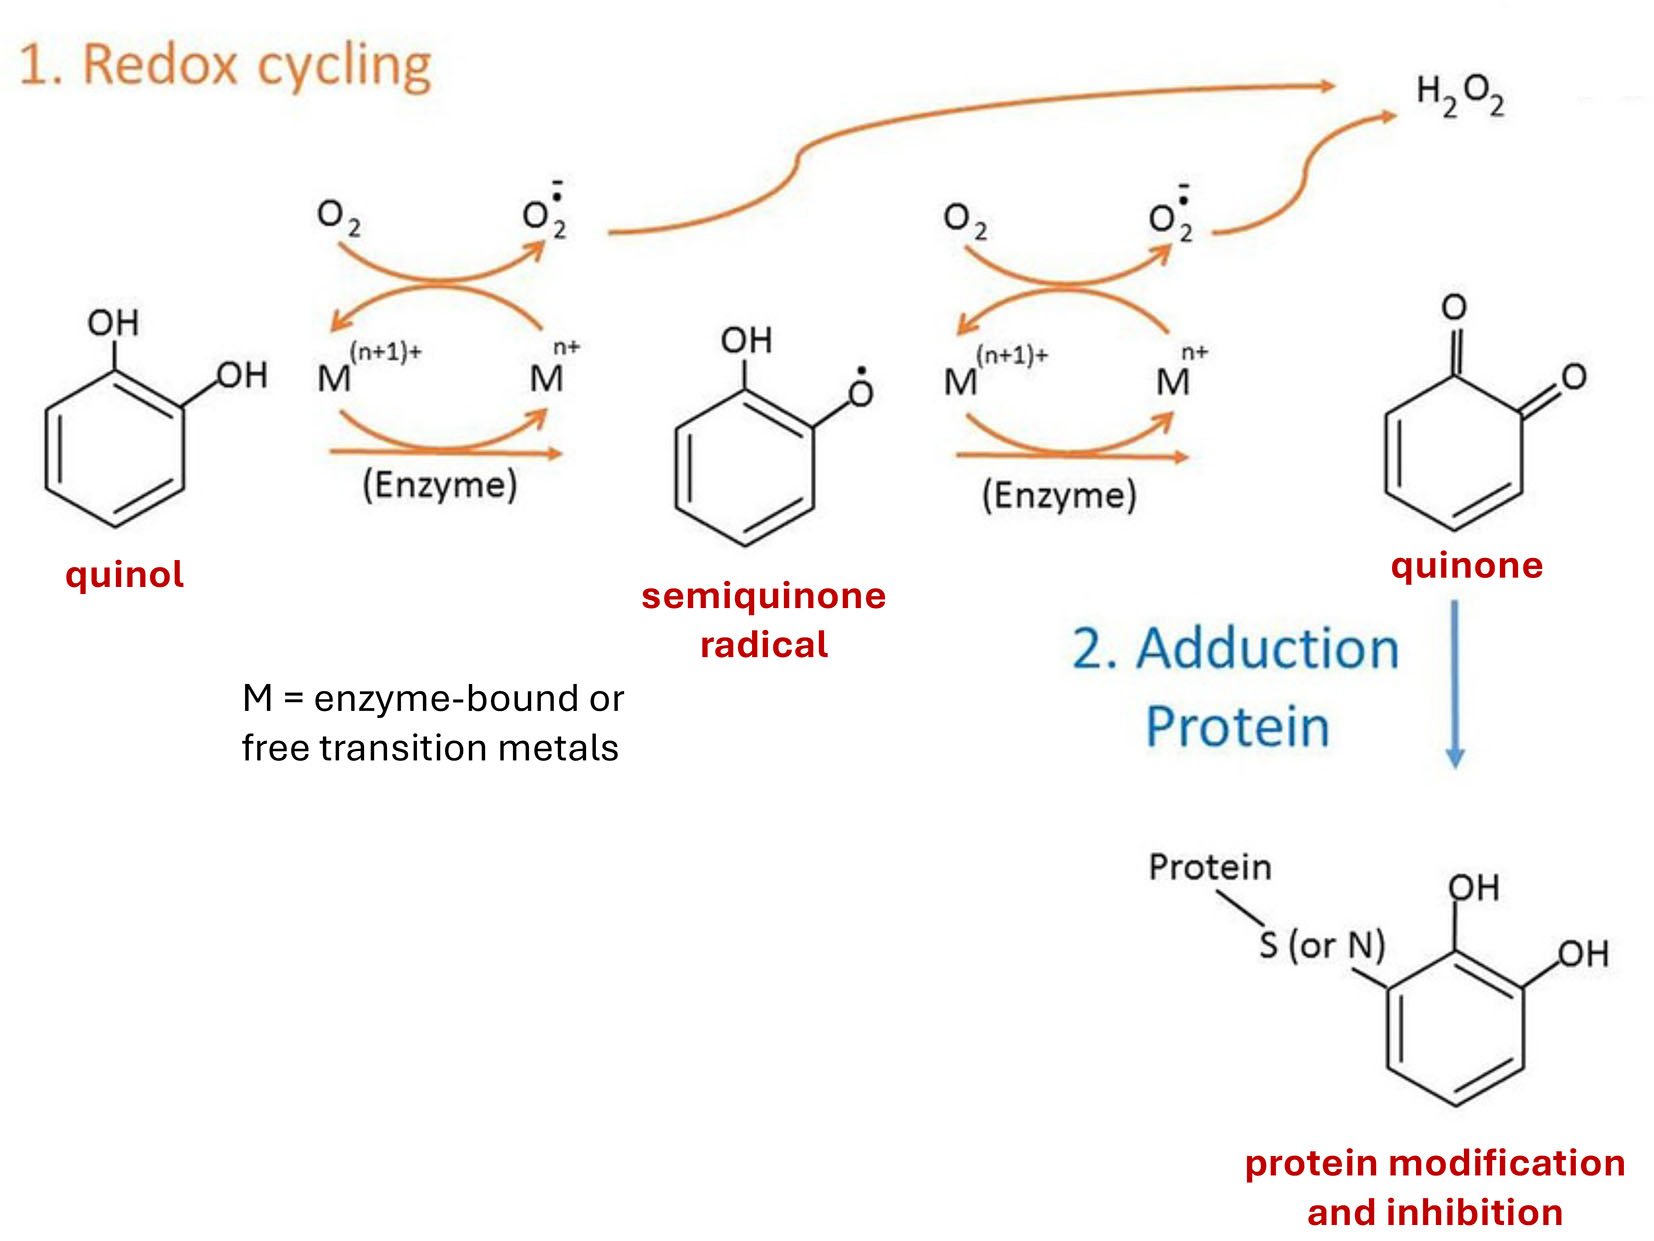
The activated quinols react with with their KEAP1 target by forming covalent bonds with cysteine residues, leading to protein inhibition.
Autooxidation of catechol quinol and covalent binding to reactive cysteines in proteins (Figure derived from Chen and Li (2019))
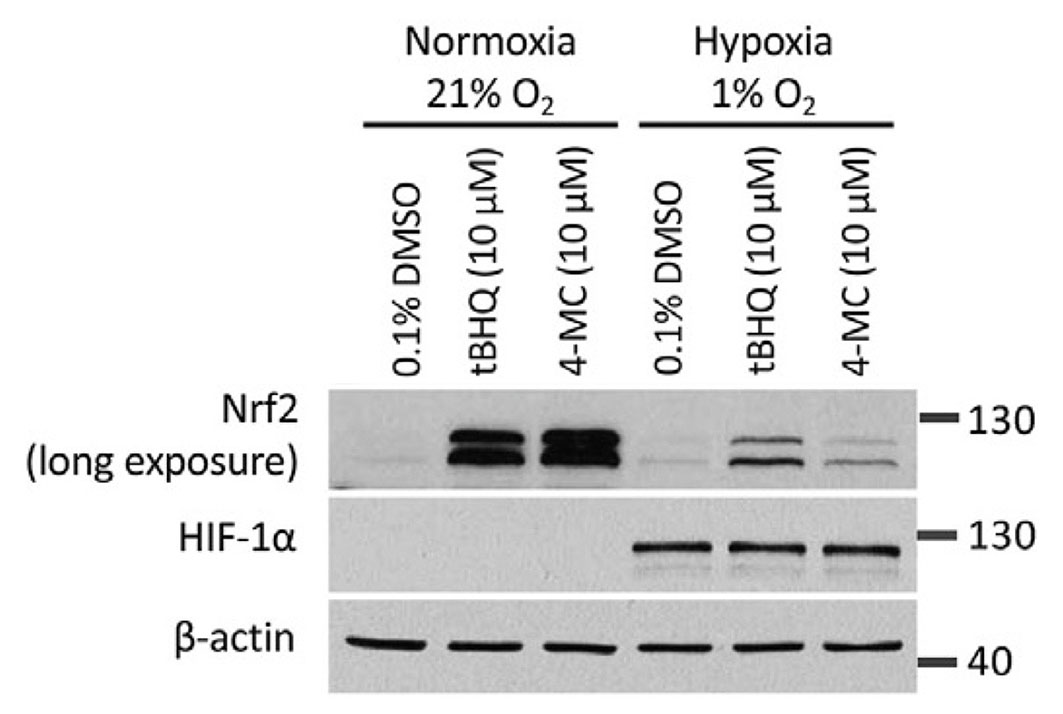
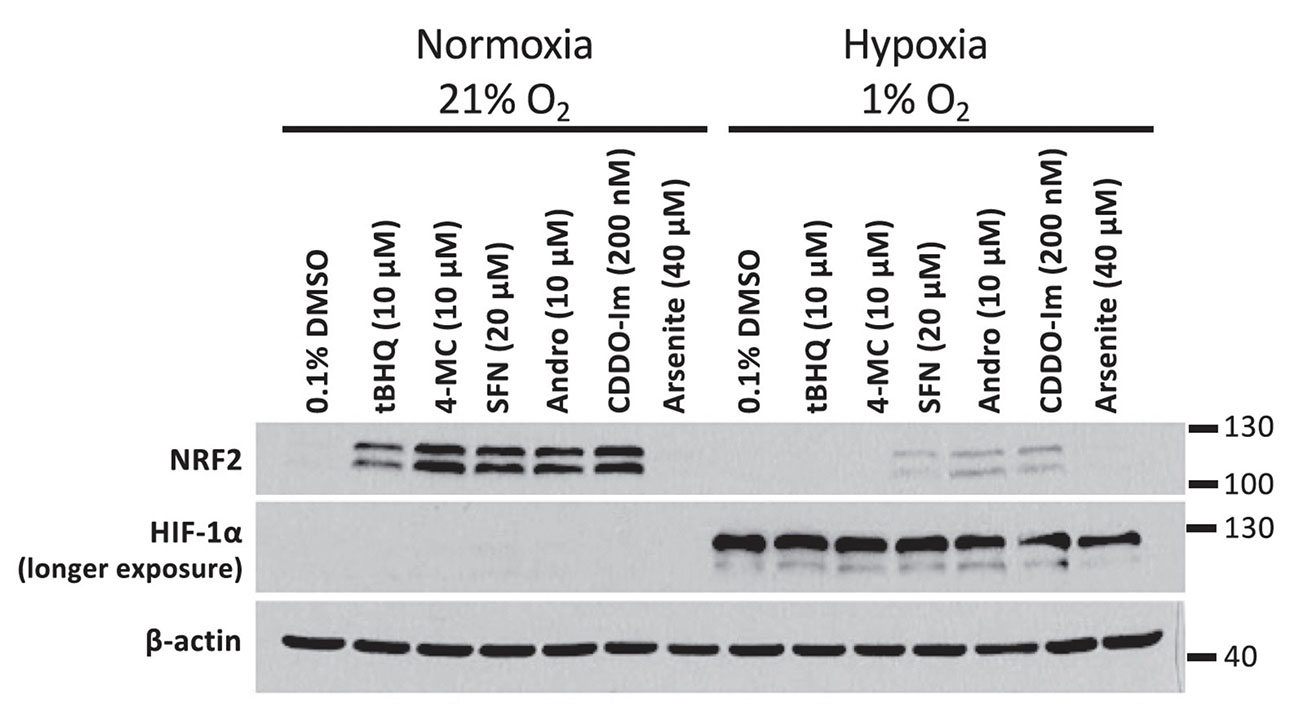
Given that the autooxidation of our activated quinol compounds is oxygen dependent, we compared the ability of the compounds to induce NRF2 in normoxia versus hypoxia. We noted that both 4-MC and tBHQ had a markedly reduced activity in hypoxia.

In the experiment, HEK293T cells were treated with 4-MC and tBHQ for 4 hours under normoxic (21% O2) or hypoxic (1% O2) conditions and the abundance of NRF2 was determined by Western blotting. The abundance of HIF-1α protein levels was measured as a control for the induction of hypoxia.
What is more, even under condition of so-called physioxia, i.e., an oxygen concentration of 4%, which is in the range of the normal oxygen concentration found in the organs in our body, both compounds had a lower activity compared to an atmospheric oxygen concentration of 21%.
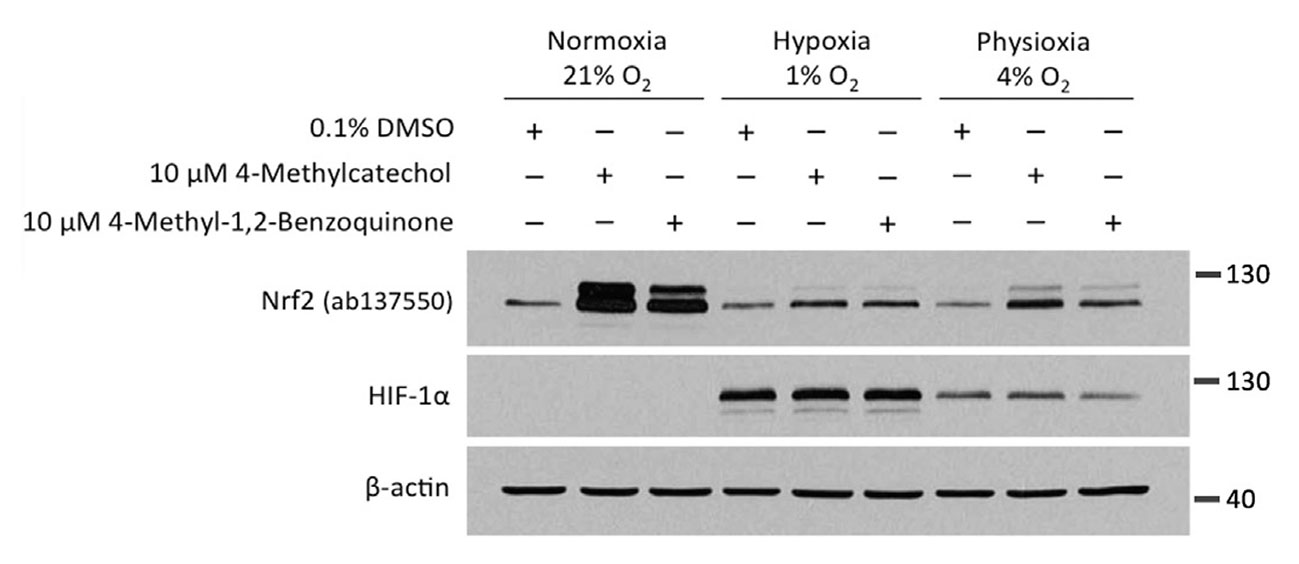
We next wanted to know whether the oxygen dependence is indeed a consequence of the need of these compounds to undergo autooxidation. Towards this end, we utilised 4-methyl-1,2-benzoquinone, the oxidised active metabolite of 4-MC.
Given that 4-methyl-1,2-benzoquinone is already active and does not require oxygen-dependent autoactivation, we expected that the compound would show a similar activity in both normoxia and hypoxia. However, unexpectedly, the activity of 4-methyl-1,2-benzoquinone was also dramatically inhibited in hypoxia.

In the experiment, HEK293T cells were treated with 4-MC and its active metabolite, 4-methyl-1,2-benzoquinone, for 4 hours at oxygen concentrations of 21%, 4%, or 1%, followed by Western blotting for NRF2 and HIF-1α.
This result suggested that the low activity of 4-MC (and presumably of tBHQ) in hypoxia may not be due to a lack of autooxidation. In further support of this, when measuring the oxygen dependence of the quinol autooxidation reaction, we found that it still proceeds at a normal rate at an atmospheric oxygen concentration of 1% (i.e. in hypoxia).
Most importantly, we found that other NRF2-inducing compounds that function via a similar mechanism as 4-MC and tBHQ, but that do not require autooxidation, also have a markedly lower activity in hypoxia.
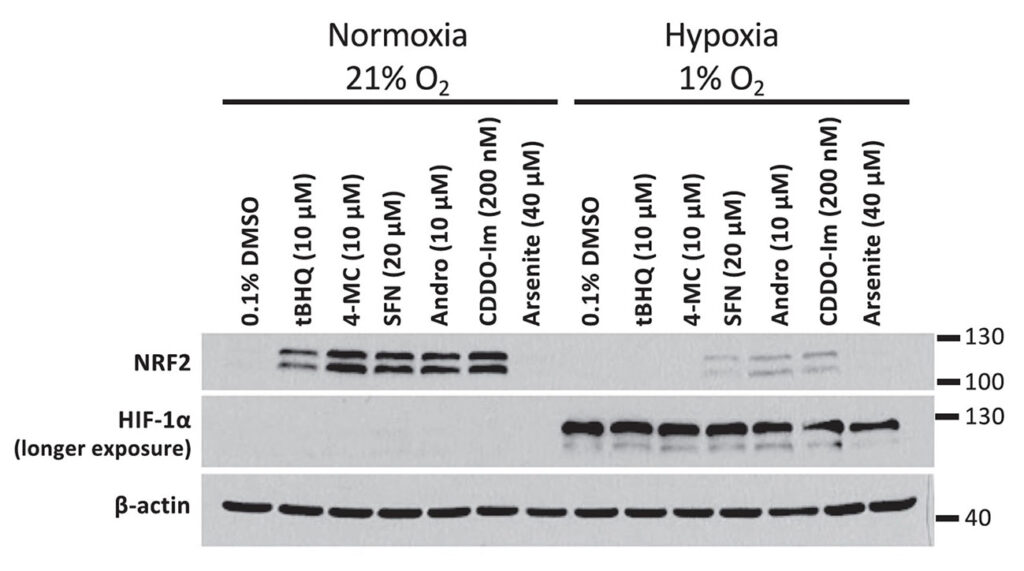
The inhibition of NRF2 activation by hypoxia is not limited to 4-MC and tBHQ, but was also observed upon incubation of HEK293T cells with other NRF2 activators: SFN = sulforaphane, Andro = andrographolide, and CDDO-imidazole.
Taken together, we thus concluded that hypoxia must inhibit NRF2 activation by 4-MC and 4-methyl-1,2-benzoquinone as well as various other compounds via an entirely different mechanism.
Naturally, we also tried to elucidate what this mechanism is. In the course of these studies, we managed to rule out various potential mechanisms, including a change in the cellular redox state or inhibition of NRF2 translation due to lack of ATP in hypoxia or mediated by hypoxia-sensitive pathways such as mTORC1 or the unfolded protein response.
When we finally measured the rate with which the NRF2 activator compounds bind to the most reactive cysteine in KEAP1, Cys151, we found that this rate is lower under hypoxic conditions, both in cells and under in vitro conditions. The mechanistic basis for the different rates in normoxia versus hypoxia are, however, currently not clear. And so I am currently actively searching for potential mechanisms!
What are the implications of our findings? Firstly, they suggest that NRF2 activators might have low activity in tumors, which are commonly hypoxic. This is significant because NRF2 is not only beneficial and cytoprotective in normal cells, but also in cancer cells. In fact, NRF2 activation, often as a consequence of loss of function mutations in KEAP1, is a hallmark of some types of cancer, most notably lung cancer.
Therefore, our results suggest that the tumor-promoting effects of potential long-term treatment with NRF2 activators may be less of a concern when considering NRF2 activation as a treatment strategy for chronic diseases such as NASH.
Second, the results imply that it is important to take into account the effect of the oxygen concentration when evaluating any new NRF2-inducing compounds. In other words, pharmaceutical companies or labs developing new NRF2 activators would be well-advised to test their compounds at physiological oxygen concentrations present in the tissues in our body as well as at low oxygen concentrations found in tumors.
MITOCHONDRIAL UNCOUPLERS
One topic we have researched on in recent years and recently published two papers about are mitochondrial uncouplers. These compounds function by increasing energy expenditure by causing our mitochondria to continuously burn fuels derived from sugar and fat. As a result, uncouplers are able to induce substantial weight loss.
On a biochemical level, uncouplers dissipate the proton gradient across the inner mitochondrial membrane. When our mitochondria burn fuel derived from carbohydrates and fats, they convert the released energy into a proton gradient across the inner membrane of our mitochondria, a cellular organelle often referred to as the powerhouse of the cell. Mitochondria then utilise this proton gradient to synthesise ATP, the universal energy currency in our body. Energy-rich ATP is synthesised from its energy-poor precursor ADP via addition of a phosphate group.
The generated ATP can then be used to drive all energy-dependent cellular functions, such as muscle contractions, protein synthesis and brain activity. In this process, ATP is converted back to ADP, and the cycle of ATP synthesis in the mitochondria and ATP utilisation in the rest of the cell continues.
One important concept required to understand the mechanisms of uncoupler compounds is the coupling of fuel oxidation to the availability of ADP. When cells do little work, there is little ADP produced through energy requiring processes. Under this condition of low ADP availability, the proton gradient across the mitochondria is not utilised to produce ATP and consequently becomes very high. A high proton gradient in turn slows down fuel oxidation because the mitochondria need to pump out protons against an increased gradient.
One could compare this to pushing a trolley up a slope. The steeper the slope (i.e., the height gradient), the more difficult it becomes to push up the trolley.
Thus, when little ADP is available and the proton gradient accumulates, fuel oxidation slows down because the energy derived from burning the fuel is not enough to pump out more protons.
Uncouplers function by providing an alternative route for protons to pass through the inner mitochondrial membrane, without producing ATP. It is like if in an hydraulic power plant we provide alternative channels for water to pass through the dam while bypassing the hydraulic turbines. Water will continuously flow without producing any electrical energy.
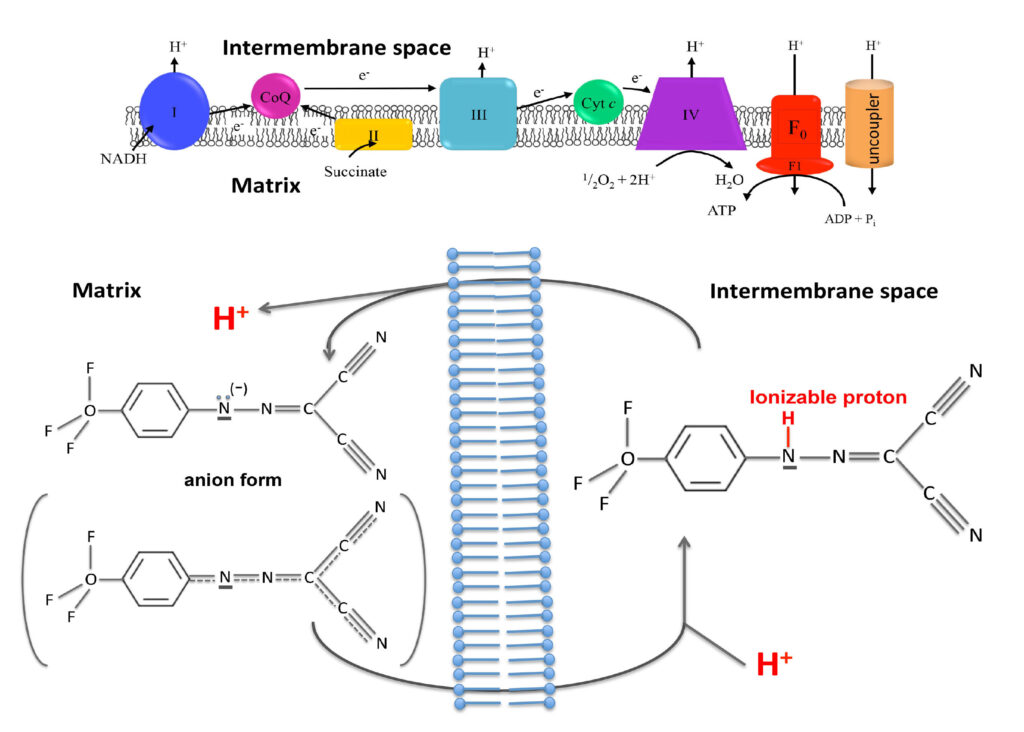
In mitochondria, uncouplers dissipate the proton gradient by shuttling the protons from the outside to the inside of the inner mitochondrial membrane. This creates a futile cycle where fuels are oxidised to create a proton gradient, which is then immediately dissipated. As a consequence, fuels are continuously burnt, resulting in weight loss.
Uncoupler compounds achieve this feat by having two important properties. First, they can exist in both a proton-bound and a proton-less state. Second, uncouplers are membrane-permeable in both of these states.
One could argue that with the discovery of new blockbuster incretin anti-obesity drugs, such as the GLP-1 agonist semaglutide (e.g. ozempic) and the dual GLP-1 and GIP agonist tirzepatide, the weight loss problem has been solved. These drugs indeed cause amazing weight loss within a short time spans.
What is more, they come with few side effects. The most common side effects are gastrointestinal symptoms, which 10% of patients taking semiglutide experience. With tirzepatide, the percentage of gastrointestinal side effects is lowered to approximately 5%.
However, after discontinuing these drugs, most patients regain two thirds of the weight they have lost while on the drug. Even if patients continue taking the drug, the weight loss effect tends to plateau after about a year. In other words, patients become tolerant to the drug.
While it is likely to be difficult for the body to develop tolerance to uncouplers, these compounds have their own set of side effects. They fall into two categories.
The first is on-targets effects. While uncouplers increase fuel oxidation, they do so at the cost of mitochondrial ATP production and therefore cause an energy deficit. This can cause dangerous complications in high energy dependent organs such as the heart if the uncoupler is not well dosed.
The proton gradient across the inner mitochondrial membrane stores potential energy, which is normally used to drive the synthesis of ATP. When mitochondria dissipate this proton gradient, the energy that is not utilised to synthesise ATP is instead released as heat. Hence, another common side effect of uncouplers is, potentially excessive, sweating.
The second type of side effects are off-target effects on unrelated cellular processes, which are common to most drugs. As such, one of the objectives in drug discovery is to develop compounds with the highest possible selectivity towards the intended target.
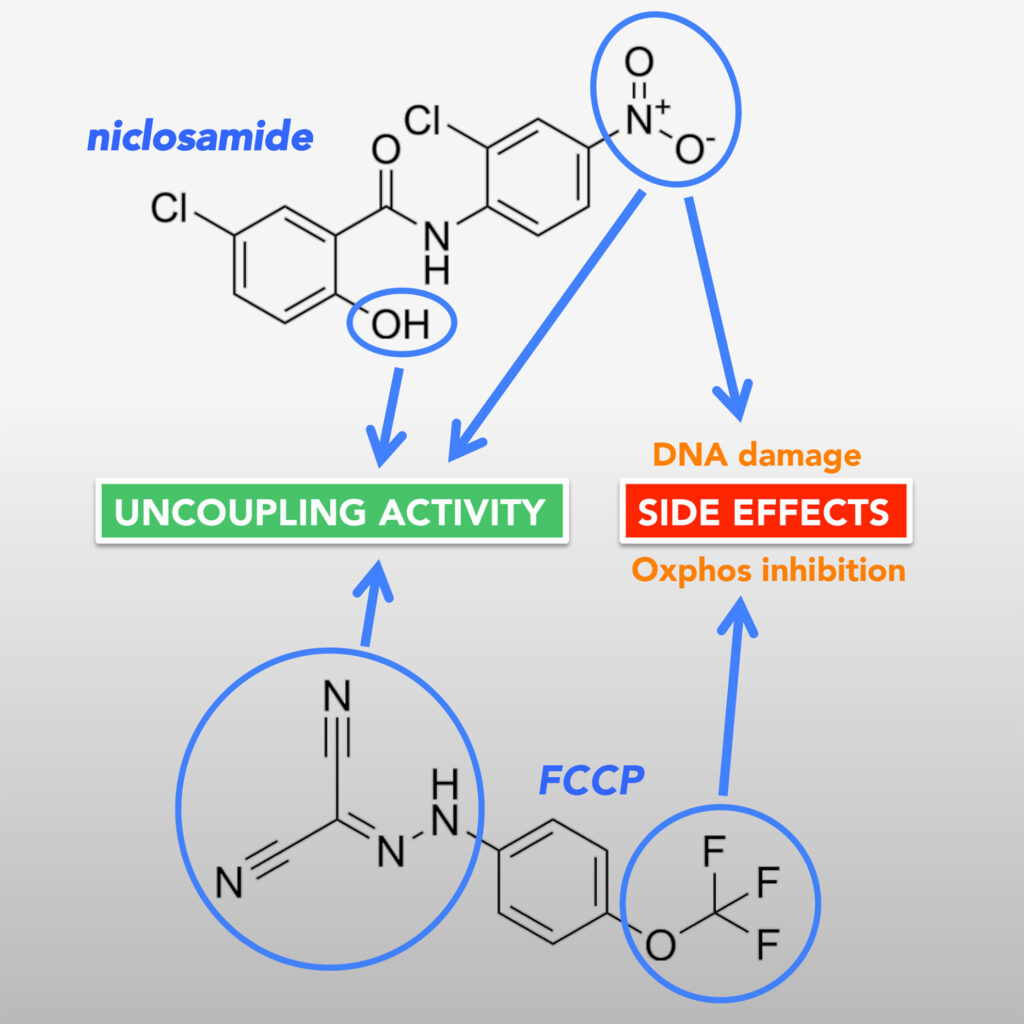
Common off-target effects of uncoupler compounds include dissipation of the proton gradient in other cellular membranes, and an inhibitory effect on the electron transport chain. In addition, the uncoupler compound niclosamide, which we have been particularly interested in, causes DNA damage.
In order to limit the unwanted effects on uncoupler drugs, researchers have pursued different approaches, for instance by developing an orally administered,
controlled-release formulation of the uncoupler 2,4-dinitrophenol. This formulation consists of polymers that form a coating around the uncoupler drug. The polymer coating contains small pores, through which the uncoupler is slowly released.
As a result, the uncoupler is present in the human body at low but steady concentrations that still exert a therapeutic effect. This avoids high peak drug concentrations that ensue if the uncoupler is administered as a pure drug. Indeed, the researchers found that the controlled release uncoupler formulation has an LD50, i.e. the dose at which a compound is lethal for 50% of tested animals, that is more than 10-fold higher than that of pure 2,4-dinitrophenol.
Another potential approach to limit side effects is to target uncouplers to specific tissues. One very successful example is the development of an
uncoupler prodrug. This prodrug is normally inactive, but is being converted to an active uncoupler by drug-metabolising cytochrome P450 enzymes. These enzymes are only expressed in the liver. Therefore, the active uncoupler only accumulates in liver tissue, thus avoiding on-target and off-target side effects in other tissues.
The uncoupler prodrug was shown by the researchers to be a remarkably potent and safe therapy for fatty liver disease, by promoting the oxidation of fatty acids in liver cells.
Notably, fatty liver disease is a major public health problem worldwide, including in Singapore. As I have recently learned from a
newsletter published by NUS Medical School, the prevalence of non-alcoholic fatty liver disease (NAFLD) in Singapore in 2019 was estimated at approximately 1,492,000, out of a total population of 5.7 million (of which approximately one third are mostly young foreign workers who are less likely to have fatty liver disease). That would mean that approximately one in three Singaporeans has fatty liver disease. What is more, the incidence of Fatty liver disease in Singapore is expected to increase to 1,799,000 by 2030.
In Singapore, rates of type II diabetes also continue to rise, with more than 400,000 people currently living with the disease. This number is projected to reach one million by 2050.
Finally, there is obesity, a major risk factor for diabetes. Obesity shows an upward trend in Singapore as well. When using the recommended Asian Body Mass Index cut-offs (which are lower than the thresholds for Western populations), in 2020, 38% of the Singapore population was overweight and 21% obese. As such, people with a body weight in the normal range are currently in the minority in Singapore.
This then brings me back to our own research studies, which were aimed at finding ways to circumvent the side effects of uncouplers and understand the structural features responsible for the side effects.
In our first
study, we tried to target uncouplers specifically to adipose tissue, thus potentially circumventing systemic side effects of these drugs.
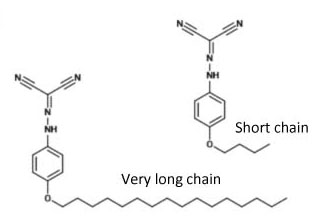
Many lipophilic compounds (i.e. compounds that mix well with lipids) have been found to selectively accumulate in adipose tissue. Hence, we explored the feasibility of conjugating uncoupler compounds with lipophilic groups. These compounds were synthesised by my former PhD student Mei Ying in the laboratory of Prof. Tan Choon Hong at NTU.


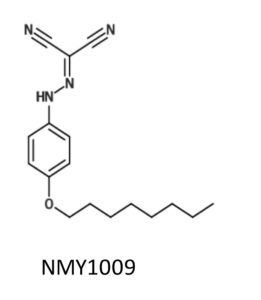
Mei Ying used hydrocarbon chains of different length, that were linked to the uncoupler compound FCCP via an ether bond. When we explored their uncoupling activity and found that a chain length of four or eight carbons had the highest activity. The activity markedly decreased with a 12 carbon chain, likely because of limited water solubility of the compound.
Hence, we decided to investigate the functional uncoupler conjugated with the longest hydrocarbon chain that still exhibited good activity, i.e. the 8-carbon chain conjugated uncoupler. We referred this compound as NMY1009, in line with the convention of labelling novel compounds with the initials of the person who synthesised them.
After characterising the compound in cells and isolated mitochondria, Mei Ying went to the laboratory of Toni Puig-Vidal at the University of Cambridge to test the compound in mice. In Cambridge, Mei Ying worked with a very experienced and dedicated senior postdoc, Sergio Rodriguez, who guided Mei Ying and led many experiments to advance the work.
To test the effect of NMY1009 on weight gain and metabolic parameters, mice were placed on a high fat diet. However, disappointingly, NMY1009 did not elicit therapeutic weight-lowering or blood glucose lowering effects in mice.
Through another collaboration with Gopal Venkatesan and Giorgia Pastorin from the Department of Pharmacy at NUS, we eventually found out why. NMY1009 was metabolically unstable. Thus, the ether bond between the uncoupler and the hydrocarbon chain was rapidly cleaved in aqueous solution.
Yet another collaborator, Marcella Bassetto from Cardiff University, synthesised a lipophilic version of another uncoupler compound related to 2,4-dinitrophenol, which I discussed at the beginning of the post. The dinitrophenol analog carrying an 8-carbon hydrocarbon chain, which was also conjugated via an ether bond, had an even higher uncoupling activity compared to its parent compound. However, like NMY1009, the lipohilic dinitrophenol analog was also highly unstable in vivo when administered to mice.
Therefore, although conjugation of a hydrophobic hydrocarbon chain to uncoupler compounds resulted in sustained or improved uncoupling activity, linking lipophilic hydrocarbon chains via ether bonds leads to metabolic instability. This was a rather unexpected result. It taught us the lesson that in the future it would be necessary to conjugate lipophilic groups via other chemical bonds.
The goal of our
second study was to find out which structural features in two of the most commonly used uncouplers, niclosamide and FCCP, are responsible for their side effects. As mentioned above, niclosamide causes DNA damage, while FCCP causes an inhibitory effect on the electron transport chain.
To carry out our study, our collaborator Marcella from Cardiff synthesised a number of niclosamide analogues. We also used some FCCP analogues that were synthesised by Mei Ying.
With the help of these compounds, we managed to obtain some interesting insights. By comparing the structural features and activities of the different analogs, we identified FCCP analogues that do not inhibit mitochondrial oxygen consumption but still provided good, although less potent, uncoupling activity. For niclosamide, we identified the two functional groups responsible for the uncoupling activity of the compound and characterised the role that these groups play. We also deduced that a nitro group that is crucial for exerting DNA damage, is also critical for promoting high uncoupling activity.
These structural investigations provide important information that could aid further drug development. For instance, given the critical role of the niclosamide nitro group in both uncoupling and DNA damage, it may be possible to substitute this group with other functional groups that exert critical electron-withdrawing properties to promote uncoupling without causing DNA damage.
Reassuringly, a recent
publication by another group has confirmed our findings with niclosamide. There is indeed much interest in niclosamide because the compound is an FDA-approved drug that is currently in clinical use to treat parasitic tapeworm infections. In recent years, niclosamide has been considered for use as a repurposed drug in the treatment of various diseases, including diabetes, fatty liver disease and cancer. The anti-cancer effects may, at least in part, be due to another mechanism of action of niclosamide, as the drug has also been shown to be a potent inhibitor of the mammalian (or sometimes also called ‘mechanistic’) target of rapamycin complex I (mTORC1 in short).
WHAT MAKES US AGE?
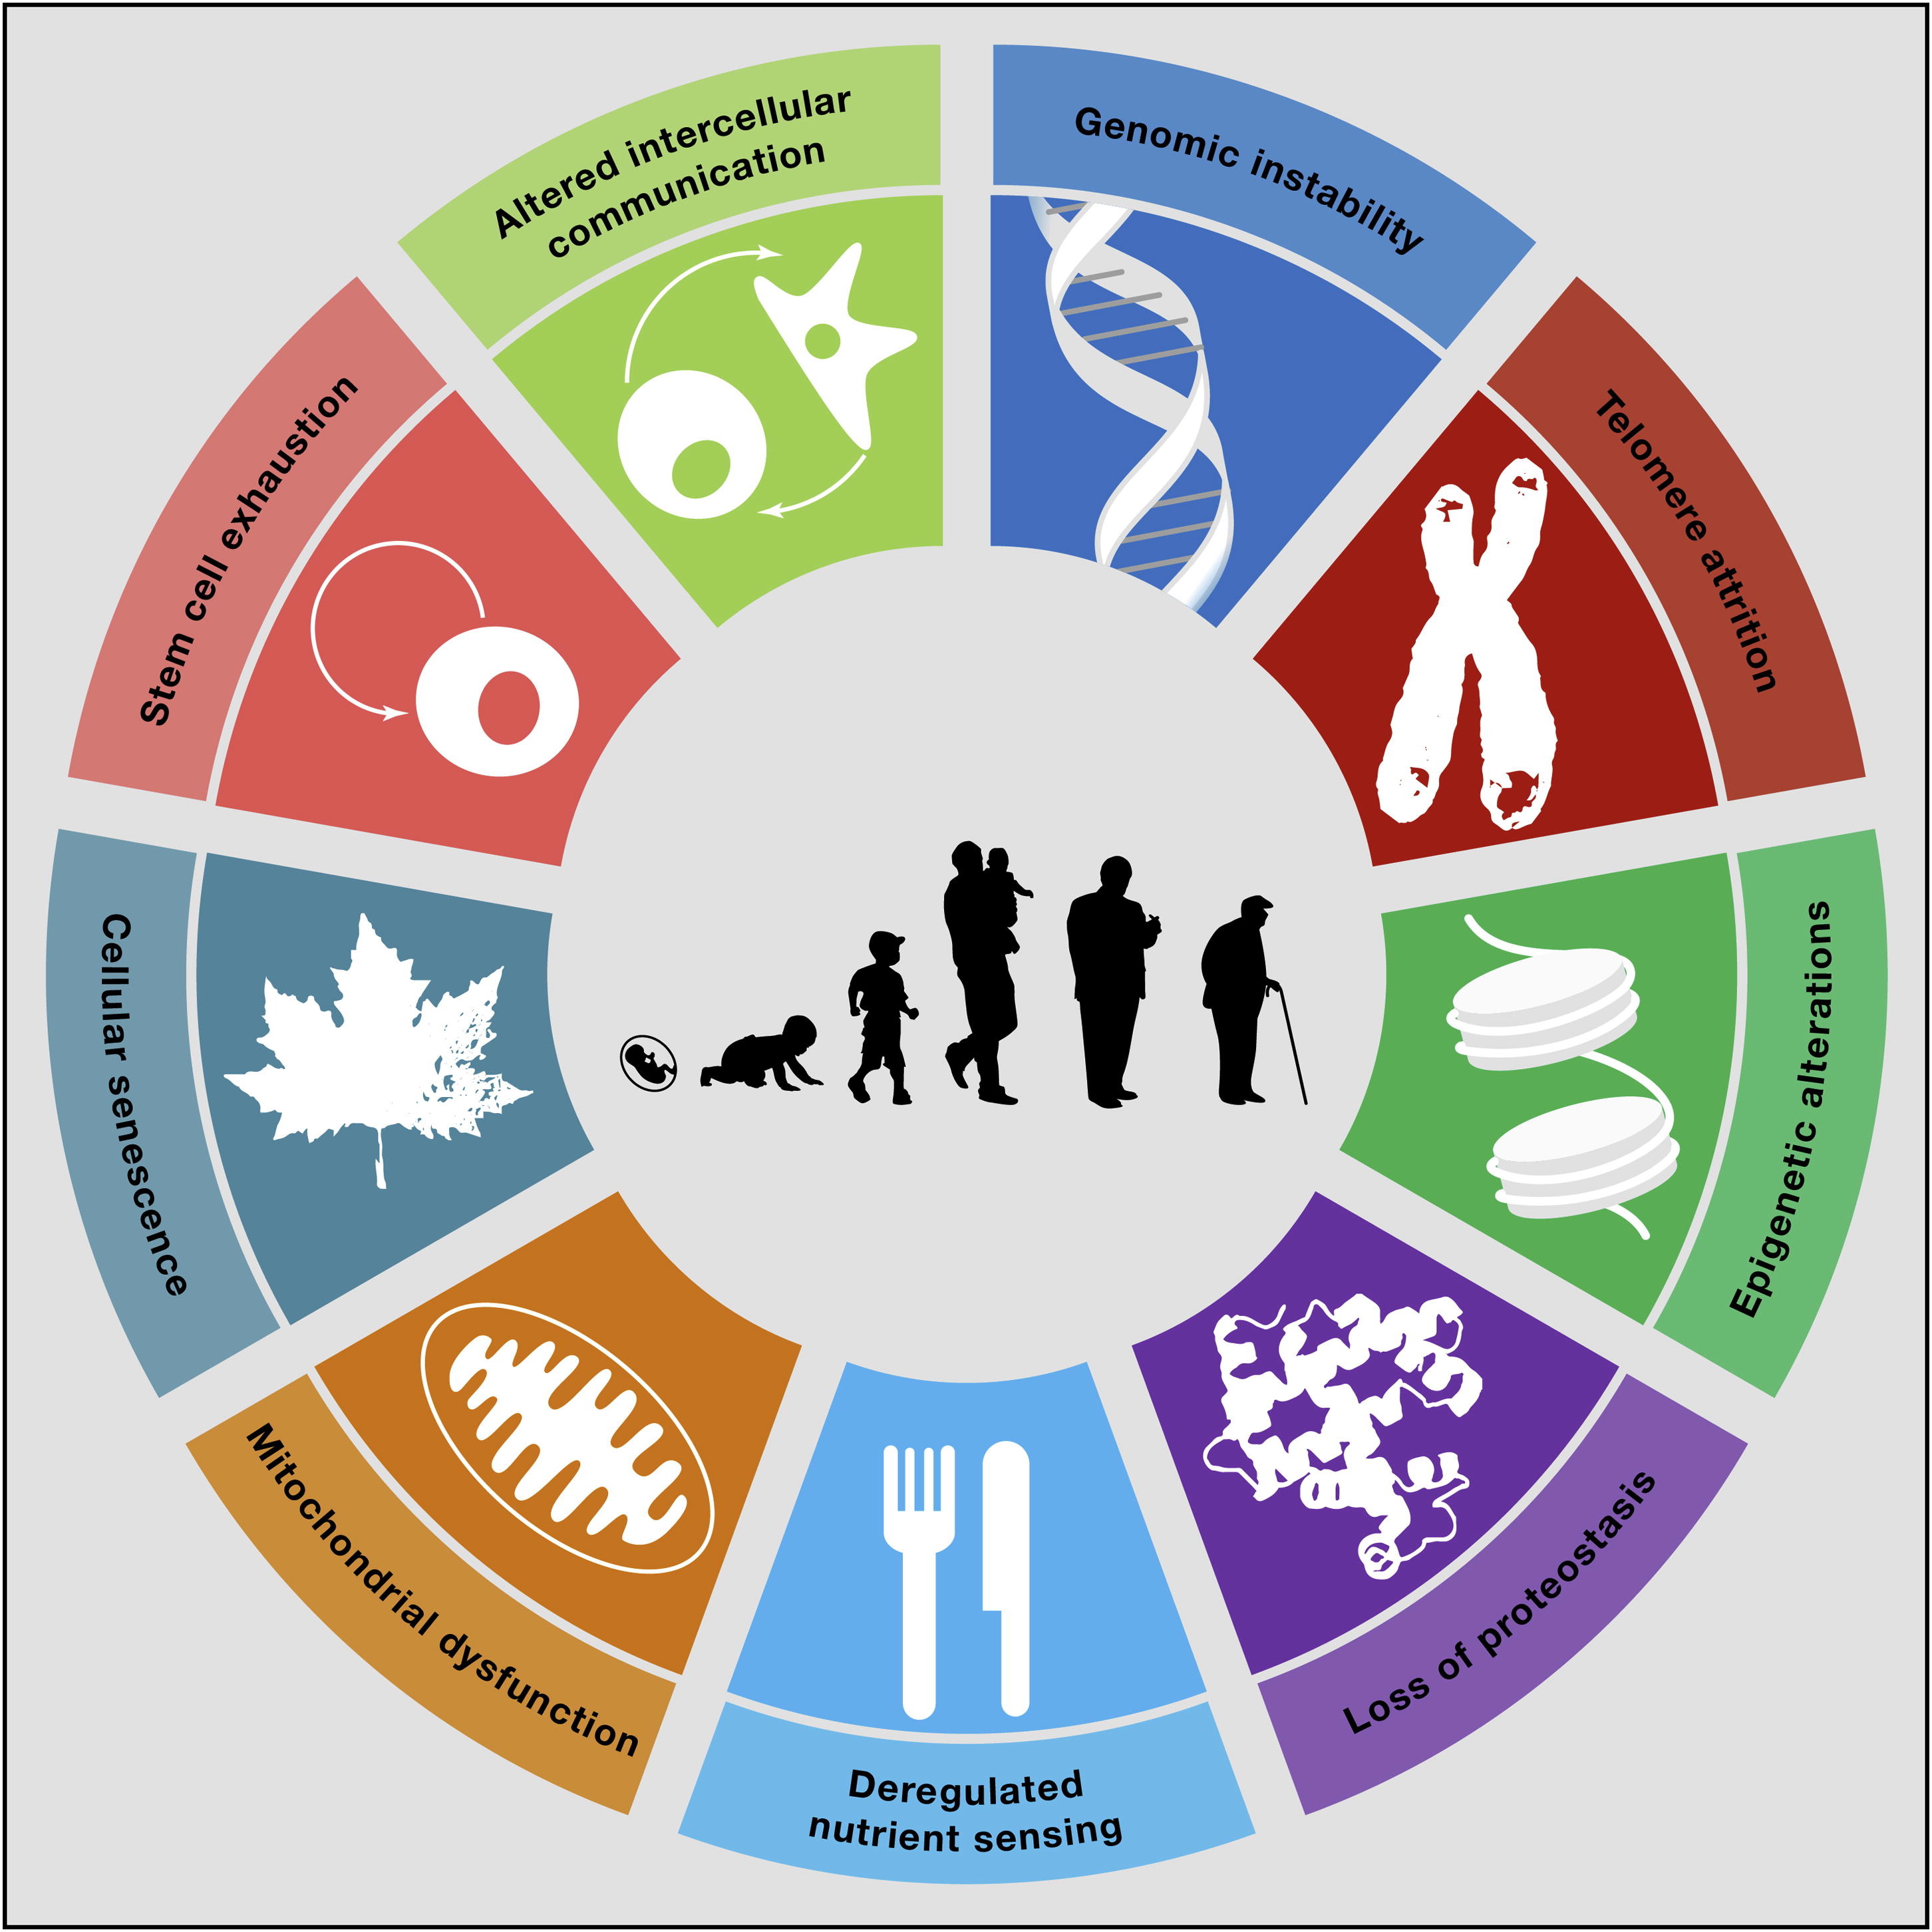
This is a question that many of you will have asked yourself at one point. There are in fact many theories of ageing. One of the most popular ones is the Free Radical Theory of Ageing (a.k.a. FRTA). It appears to be a plausible theory, according to which ageing is due to cumulative oxidative damage to our cells and organs, resulting from constant reactive oxygen species (ROS) production. The major source of cellular ROS is the mitochondrial electron transport chain. The generated ROS, such as superoxide, hydrogen peroxide and hydroxyl radicals, can react with proteins, DNA and lipids, leading to protein dysfunction, DNA mutations and membrane damage, respectively. Due to the high reactivity of ROS, most of the damage incurred by ROS is expected to be directly in the mitochondria. Indeed, mitochondrial dysfunction with ageing has been consistently observed in various ageing model system. Mitochondrial dysfunction has in fact been recognized as one of the hallmarks of ageing (see Figure).
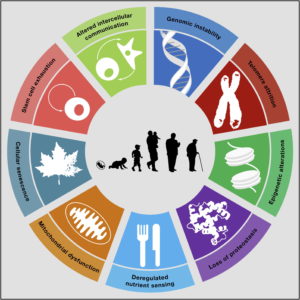 From: Carlos Lopez-Otin et al. The Hallmarks of Ageing. (2013) Cell Volume 153, Issue 6, p.1194-1217.
The fact that there is mitochondrial dysfunction with ageing is of course not proof that the FRTA is indeed true. Providing proof would require to demonstrate that mitochondrial dysfunction during ageing and ageing itself is actually due to ROS, or in other words to show that preventing oxidative damage prevents mitochondrial dysfunction and extends lifespan. To provide this proof, researchers have carried out intervention experiments in various model organisms. In these studies, the researchers used treatment with antioxidant compounds or transgenic animal models with altered expression of antioxidant enzymes to prevent oxidative damage. However, these experiments have often not resulted in the expected results and generally not resulted in an extension of lifespan. This has resulted in wide-spread scepticism about the validity of the FRTA.
If not ROS, what then is the cause of mitochondrial dysfunction during ageing? Apart from oxidation, another form of protein modification is acylation. Protein acylation is the addition of an acyl group to a protein, typically to the ε-amino group of lysine amino acids in proteins (see Figure). The substrates for protein acylation are energy rich acyl-coenzyme A thioesters, such as acetyl-CoA and succinyl-CoA, resulting in protein acetylation and succinylation, respectively. The best-known protein substrates that become acylated with an acetyl group are histone proteins. Histone acetylation plays an important role in regulating gene expression and is catalysed by specific histone acetyl transferases. It has become clear in recent years that numerous mitochondrial proteins are also acylated (Wagner and Payne, 2013). In contrast to histones, mitochondrial proteins are acylated in a non-enzymatic manner. This chemical process is aided by the high mitochondrial acyl-CoA concentrations and the higher pH found in mitochondria (Wagner and Payne, 2013).
Of note, acylation of mitochondrial proteins normally leads to an inhibition of the function of the modified protein. Based on this, we hypothesised that mitochondrial dysfunction during ageing could be a consequence of an increase in mitochondrial protein acylation. A former PhD student in the lab, Hong Shin Yee, took a first step to test this hypothesis, by trying to test if there is an age-dependent increase in mitochondrial protein acylation.
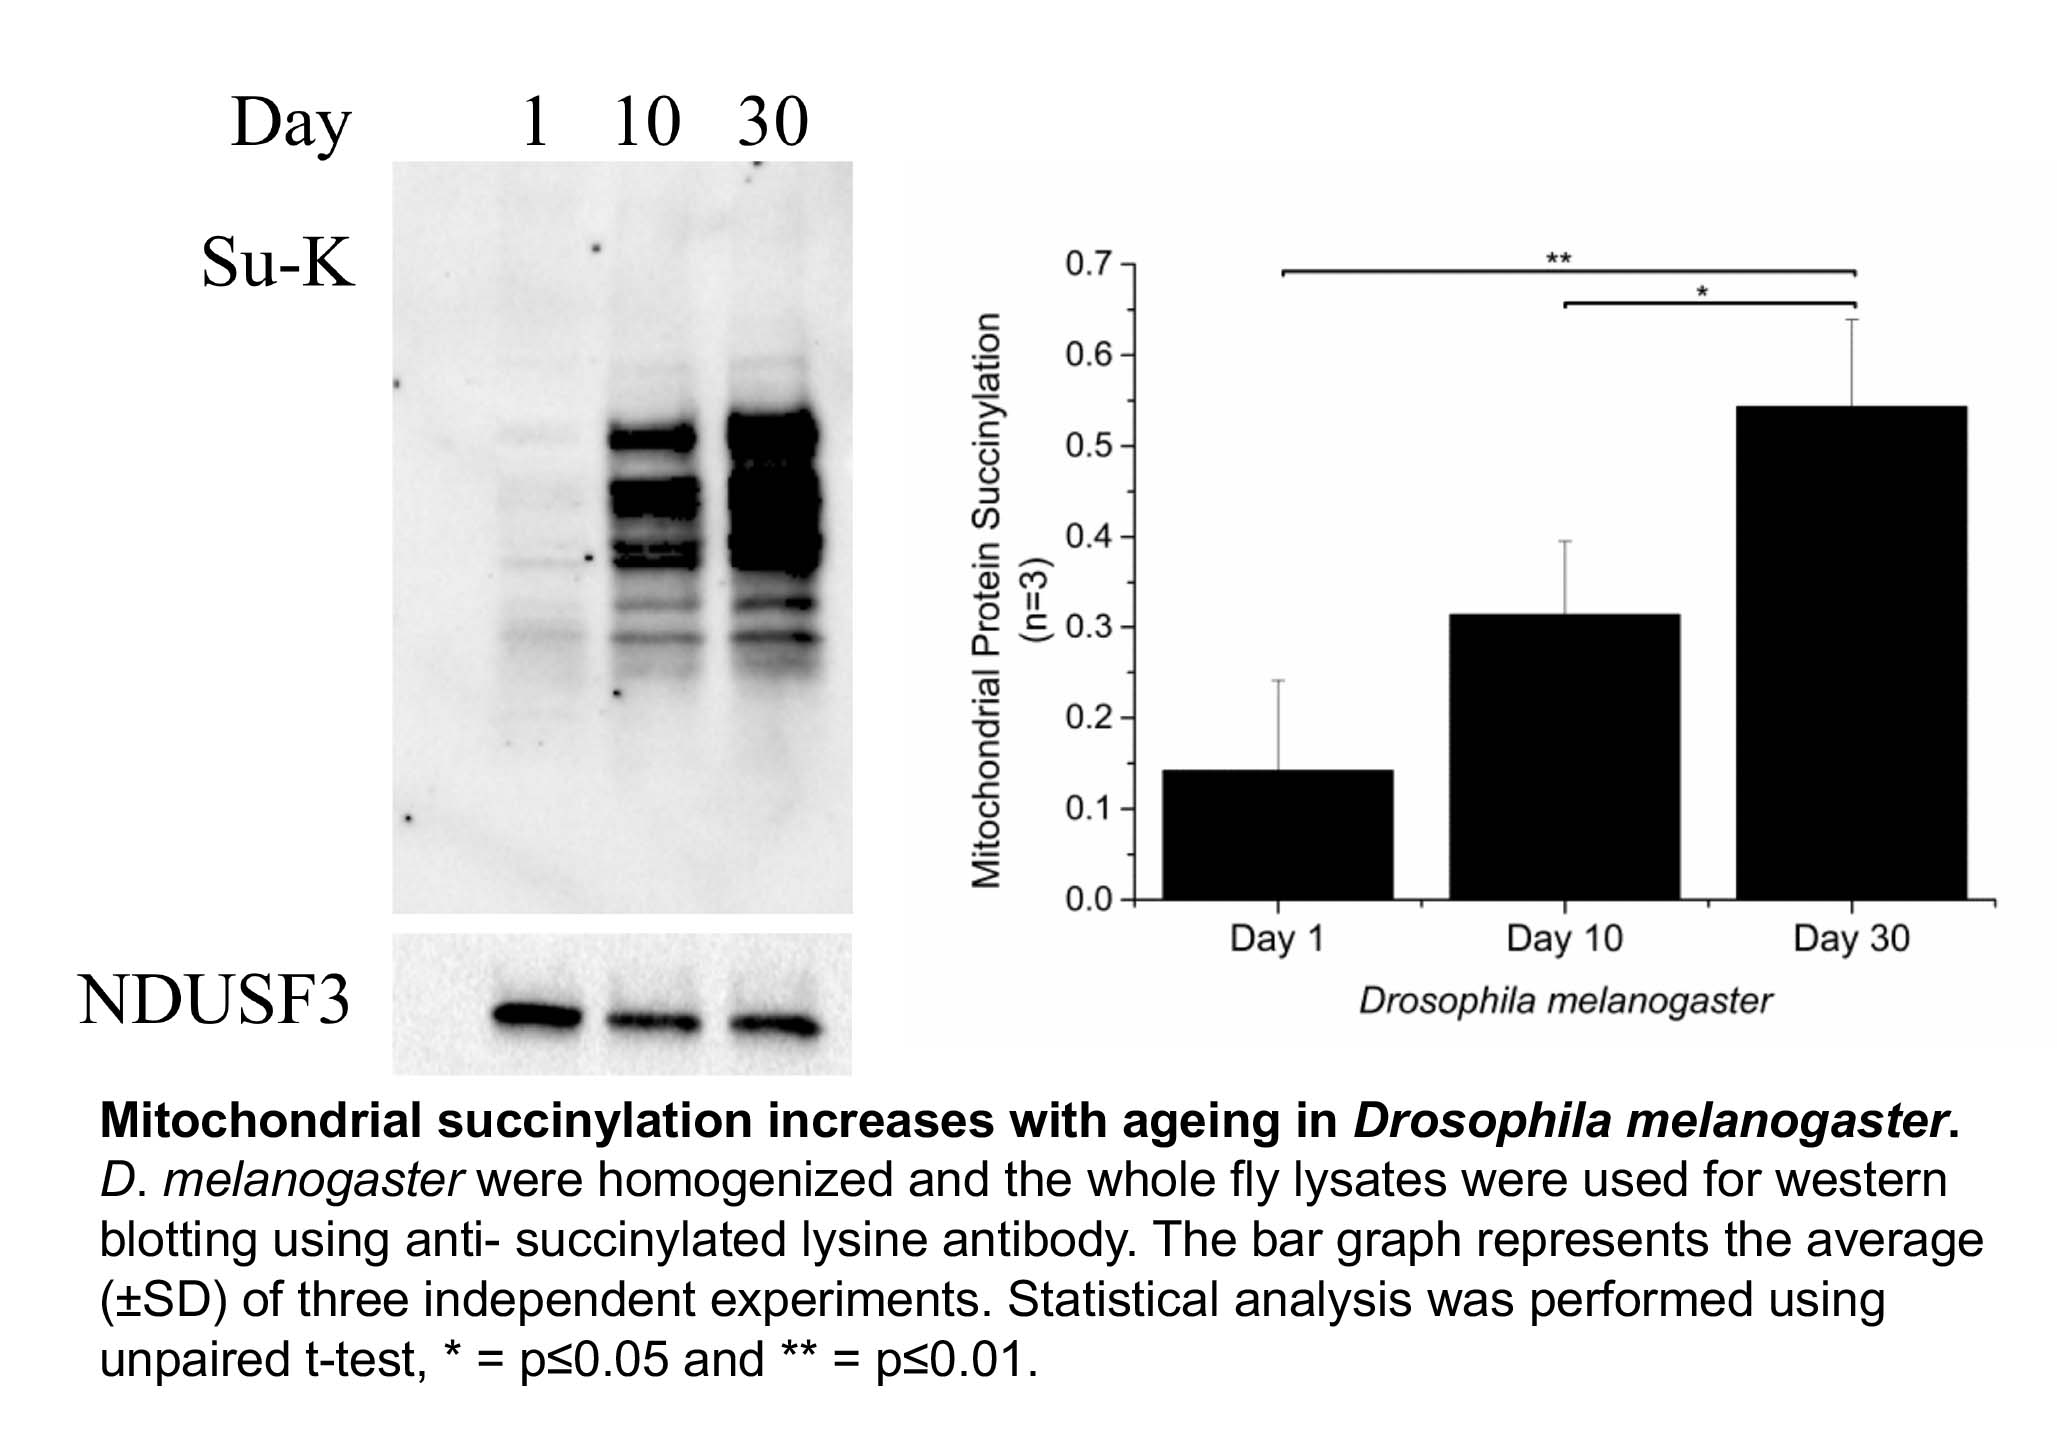
Shin Yee looked at three different organisms, the roundworm C. elegans, Drosophila melanogaster (fruit fly) and mice. We did not find a robust increase in protein acetylation with increasing age. However, Shin Yee observed that mitochondrial protein succinylation increases with age in both C. elegans and Drosophila (see Figure). This result raises the possibility that an age dependent increase in protein succinylation could be a contributing factor to mitochondrial dysfunction during ageing.

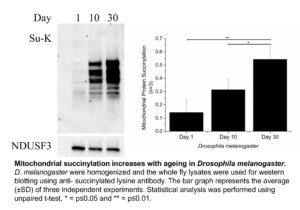
However, when Shin Yee looked for age dependent changes in protein succinylation in mice, no consistent trends could be found. What could be the reason for the discordant results in C. elegans and Drosphila on the one hand versus mice on the other hand. There are a number of possible explanations. For instance, the mice that we studied may simply not have been old enough to display an increase in mitochondrial protein succinylation. There is also another possibility, which is that the age dependent increase in protein succinylation in C. elegans and Drosophila is due to the absence of deacylating enzymes (known as Sirtuins) in these organisms.
Sirtuins are proteins that can remove acyl groups, such as acetyl- and succinyl-modifications, from proteins. Mice express seven sirtuin isoforms (SIRT1-SIRT7). Three of these sirtuin enzymes (SIRT3, SIRT4, and SIRT5) are localized in mitochondria. C. elegans and Drosophila also have multiple SIRT isoforms, but the only isoform that is present in mitochondria is a homolog of SIRT4. Of note, SIRT5, the major SIRT isoform that removes succinyl groups from proteins, is absent in both C. elegans and Drosophila. Hence, this suggests that the presence of SIRT5 in mice (and humans) may be important to prevent an age-dependent increase in mitochondrial protein succinylation and maybe even to protect ourselves from mitochondrial dysfunction during ageing. As always, more research is required to test these hypotheses… For now, we can say that in addition to protein oxidation, protein acylation is another protein modification that could be of importance in ageing and human disease.
To read more about this exciting topic, you can click on this link, which will take you to a student assignment of one of the former LSM2103 (now LSM2233) Cell Biology students. www.sibiol.org.sg/sites/default/files/AYJB/AYJB_2014v02_21-23.pdf
Other references:
Hong SY, Ng LT, Ng LF, Inoue T, Tolwinski NS, Hagen T, Gruber J. The Role of Mitochondrial Non-Enzymatic Protein Acylation in Ageing. PLoS One (2016) Volume 11, p.e0168752 www.ncbi.nlm.nih.gov/pubmed/?term=28033361
Wagner GR, Payne RM. Widespread and enzyme-independent Nε-acetylation and Nε-succinylation of proteins in the chemical conditions of the mitochondrial matrix. J. Biol. Chem. (2013) Volume 288, pp.29036-45 www.ncbi.nlm.nih.gov/pubmed/23946487
Carlos Lopez-Otin et al. The Hallmarks of Ageing. Cell (2013) Volume 153, p.1194-1217 www.ncbi.nlm.nih.gov/pubmed/23746838
HOW DO CANCER CELLS INDUCE THE WARBURG EFFECT?
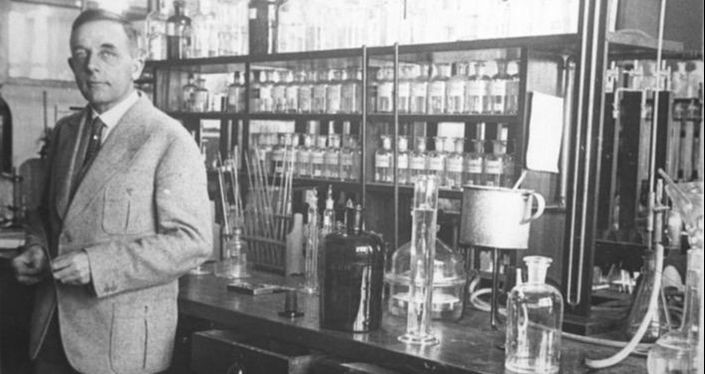
The Warburg effect of cancer cell metabolism was discovered by Otto Warburg about a hundred years ago. And researchers are still studying its mechanism and role in tumorigenesis. That is amazing.
What is the Warburg effect? The Warburg effect is the characteristic of cancer cells to predominantly produce their energy through a high rate of glycolysis followed by lactic acid production. In other words, cancer cells predominantly produce ATP from glycolysis and not like other cells mostly from oxidative phosphorylation in mitochondria, even in the presence of abundant oxygen. It is believed that one reason why cancer cells undergo the Warburg effect is that it allows them to have more metabolic intermediates available as building blocks for the synthesis of macromolecules. These intermediates include metabolites derived from the TCA cycle due to lower oxidative phosphorylation rates and from glycolysis due to greater glucose intake. Synthesis of macromolecules from these building blocks is essential to support tumor cell growth and division.
 Otto Warburg, the discoverer of the “Warburg effect”
How do cancer cells re-program their metabolism to adopt the Warburg like phenotype? For a Warburg like metabolism to be induced, there are two major changes that must take place. Firstly, there is inhibition of oxidative phosphorylation in the mitochondria. This is frequently achieved by preventing pyruvate metabolism and diverting the pyruvate from mitochondria to being converted to lactate in the cytosol. Pyruvate diversion is commonly induced through inhibition of pyruvate dehydrogenase via phosphorylation. Pyruvate Dehydrogenase normally converts pyruvate in mitochondria to acetyl-CoA, which in turn then enters the TCA cycle. Another mechanism through which mitochondrial pyruvate metabolism is inhibited is via a downregulation of the mitochondrial pyruvate transporter in cancer cells. As a result, uptake of pyruvate into mitochondria is inhibited.
In the absence of oxidative phosphorylation, cells need to produce ATP via glycolysis. However, glycolysis only produces a fraction of the ATP that is normally produced by oxidative phosphorylation. Hence, cells must greatly increase their glucose consumption and glycolytic rate. Therefore, the second requirement for the induction of the Warburg effect is an upregulation of glycolysis. However, the mechanisms involved in the upregulation of glycolysis are less well understood.
One of the well-known activators of glycolysis is insulin, especially in insulin sensitive tissues such as skeletal muscle and adipose tissue. In these tissues, insulin functions primarily by promoting the translocation of the glucose transporter GLUT4 from intracellular storage vesicles to the plasma membrane. Signaling by growth factors such as insulin is frequently also activated in cancer, often as a result of activating mutations in Receptor Tyrosine Kinases or downstream intermediates in the insulin signaling pathway. However, cancer cells do not express GLUT4.
Of note, there is evidence that in cancer cells insulin signaling regulates a different glucose transporter, GLUT1. For instance, it has been shown that inhibiting insulin signaling in a cancer cell line with a constitutively active insulin signaling pathway prevents GLUT1 plasma membrane localisation (Makinoshima et al., 2015). However, what is the mechanism through which insulin signaling regulates GLUT1 plasma membrane localization?
Enters TXNIP, or Thioredoxin Interacting Protein. As the name suggests, TXNIP was originally found to regulate the activity of the antioxidant protein thioredoxin. However, when TXNIP knockout mice were generated some 10 years ago, it became clear that the major function of TXNIP is to regulate glucose and lipid metabolism. One of the major phenotypes of the TXNIP knockout mice is a low blood sugar concentration (or hypoglycemia). TXNIP was in fact found to normally inhibit cellular glucose utilization. Hence, lack of TXNIP expression leads an increase in cellular glucose consumption and consequently to hypoglycemia.
How does TXNIP inhibit cellular glucose utilization? TXNIP actually promotes the endocytosis of the GLUT1 glucose transporter (Wu et al., 2013). As a result, TXNIP downregulates the cellular uptake of glucose.
Based on the roles of insulin and TXNIP to regulate cellular glucose uptake via GLUT1, we hypothesized that insulin signaling might increase cellular glucose uptake by downregulating TXNIP expression. As shown in the Figure below, we found that this is indeed the case. Addition to cells of serum (which contains various growth factors that activate insulin signaling) or of insulin itself leads to a marked downregulation of TXNIP mRNA and protein expression. Conversely, inhibiting insulin signaling led to marked upregulation of TXNIP. Of note, it has been reported that TXNIP is downregulated in tumors and that lack of TXNIP promotes the development of various cancers. In conclusion, downregulation of TXNIP upon activation of insulin signaling is likely important in increasing glycolysis in cancer cells and thus promoting the Warburg effect.
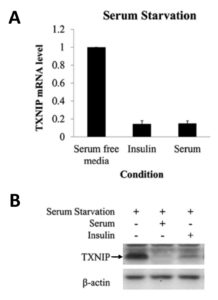
Serum and insulin suppress TXNIP expression at the protein and mRNA levels.
HeLa cells were starved of serum (containing growth factors) overnight, followed by the addition of insulin or 10% fetal bovine serum for 4 hours. The mRNA level of TXNIP was quantified using quantitative Real-Time-PCR (A) or by Western blotting (B).
Here is the link to Shin Yee’s paper, in which this work is described in detail.
Hong SY, Yu FX, Yan L, Hagen T. Oncogenic activation of the PI3K/Akt pathway promotes cellular glucose uptake by downregulating the expression of thioredoxin-interacting protein. Cellular Signalling (2016) 28:377–383 ncbi.nlm.nih.gov/pubmed/26826652
Other references:
Makinoshima H, Takita M, Saruwatari K, Umemura S, Obata Y, Ishii G, et al. Signaling through the phosphatidylinositol 3-kinase (PI3K)/mammalian target of rapamycin (mTOR) axis is responsible for aerobic glycolysis mediated by glucose transporter in epidermal growth factor receptor (EGFR)-mutated lung adenocarcinoma. J Biol Chem (2015) 290:17495-17504 www.ncbi.nlm.nih.gov/pubmed/26023239
Wu N, Zheng B, Shaywitz A, Dagon Y, Tower C, Bellinger G, et al. AMPK-dependent degradation of TXNIP upon energy stress leads to enhanced glucose uptake via GLUT1. Mol Cell (2013) 49:1167–1175 www.ncbi.nlm.nih.gov/pubmed/23453806
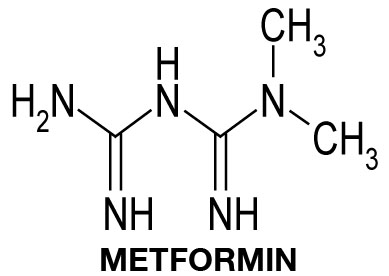
MECHANISM OF ACTION OF THE ANTI-DIABETES DRUG METFORMIN
If you have read the post about the Warburg effect in cancer cells, you already know that we are interested in the TXNIP protein. To summarize again what TXNIP is, the abbreviation stands for Thioredoxin Interacting Protein. The main function of TXNIP appears to be the inhibition of cellular glucose metabolism. TXNIP inhibits plasma membrane localisation of GLUT1, the major glucose transporter in most cells. As a result, cellular glucose uptake is inhibited. Recent evidence suggests that TXNIP also negatively regulates the insulin-sensitive GLUT4 glucose transporter.
Metformin is the most commonly prescribed drug for the treatment of diabetes. Diabetes starts with the development of insulin resistance in organs such as skeletal muscle, adipose tissue and liver. Insulin resistance is initially compensated by increased insulin secretion by pancreatic beta-cells. However, eventually beta-cells fail to produce the required amounts of insulin, leading to a rise in the blood glucose concentration and the development of full Diabetes. Metformin functions by improving insulin resistance, in other words by increasing cellular uptake and utilisation of glucose.

The mechanisms through metformin exerts its effect to increase cellular glucose localization are still being debated. One proposed mechanism is the inhibition of oxidative phosphorylation in mitochondria. This effect of metformin is due to inhibition of complex I of the electron transport chain and/or the enzyme glycerol-3-phosphate dehydrogenase 2, which delivers electrons to coenzyme Q in the electron transport chain. Inhibition of the mitochondrial electron transport chain leads to lower rates of ATP synthesis in the mitochondria. As a result, the cells are forced to produce more ATP via glycolysis. However, the yield of ATP produced from glycolysis is much lower compared to ATP production from mitochondrial oxidative phosphorylation. As a result, the cells need to take up more glucose, thus improving glucose disposal and insulin sensitivity.
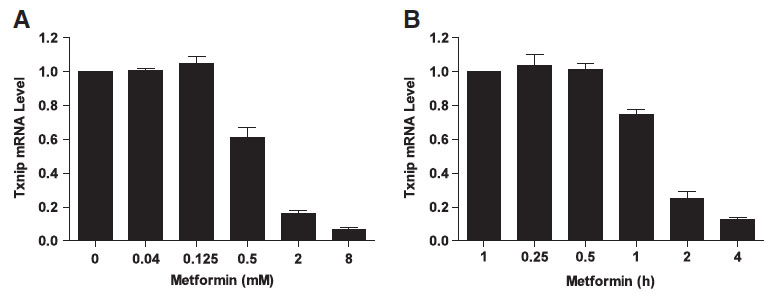
We hypothesised that metformin may also have a direct effect on cellular glucose uptake by regulating the expression of TXNIP. This idea came originally from the work of our collaborator Dr. Faxing Yu from IMCB, A*STAR (who is now a professor at Fudan University). Faxing showed that metformin dramatically downregulates TXNIP expression in different cell lines. Tiffany Chai, an honours student in our laboratory, then studied this effect.
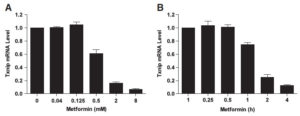
Txnip protein and mRNA expression are downregulated in the presence of metformin. HeLa cells were treated with different concentrations of metformin for 2 h (A) or 2 mM metformin for various periods of time (B), followed by measuring the Txnip mRNA expression with quantitative Real-Time-PCR.
The main regulator of TXNIP expression is the MondoA/MLX transcription factor. Tiffany showed that metformin reduces the binding of MondoA/MLX to the TXNIP promoter. But how does metformin regulate the MondoA/MLX transcription factor?
MondoA/MLX activity is dependent on glucose. As mentioned above, metformin is known to inhibit mitochondrial electron transport chain activity and consequently to increase cellular glucose uptake and utilisation via glycolysis. As expected, treatment of cells with metformin resulted in a lower consumption of oxygen, the terminal electron acceptor of the electron transport chain. Upon metformin treatment of cells, we also observed a greater consumption of glucose and an increased conversion of glucose into lactate.
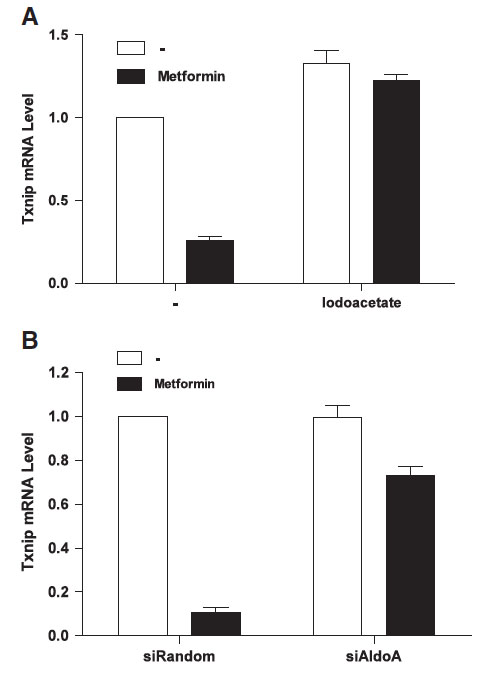
We therefore wanted to know if the increased glycolytic rate induced by metformin plays a role in the repression of TXNIP expression by the anti-diabetes drug. Thus, we tried to prevent the increase in the glycolytic rate upon metformin addition with the GAPDH inhibitor iodoacetate. Interestingly, we found that iodoacetate prevented both the effect of metformin on glycolysis and on TXNIP expression. Similarly, siRNA mediated silencing of the expression of the glycolytic enzyme aldolase also prevented the metformin induced decrease in TXNIP expression. This suggests that the effect of metformin on TXNIP expression is related to the increased glycolytic rate upon drug treatment. However, the exact mechanism through which glycolytic flux regulates TXNIP expression remains to be elucidated.
 Inhibition of GAPDH or Aldolase enzyme activity prevents the TXNIP downregulation induced by metformin. (A) HeLa cells were preincubated with 0.5 mM iodoacetate for 10 min followed by 4 h incubation in the presence of 2 mM metformin. Txnip mRNA level was measured using quantitative Real-Time-PCR. (B) Aldolase expression was suppressed using aldolase siRNA. After incubation for 3 days, 2 mM of metformin was added and cells were incubated for 4 h followed by mRNA extraction and quantitative RT-PCR.
Here is Tiffany’s paper:
Chai TF, Hong SY, He H, Zheng L, Hagen T, Yan L, Yu FX. A potential mechanism of metformin-mediated regulation of glucose homeostasis: Inhibition of Thioredoxin-interacting protein (Txnip) gene expression. Cellular Signalling (2012) 24:1700–1705
www.ncbi.nlm.nih.gov/pubmed/23453806


 From: Carlos Lopez-Otin et al. The Hallmarks of Ageing. (2013) Cell Volume 153, Issue 6, p.1194-1217.
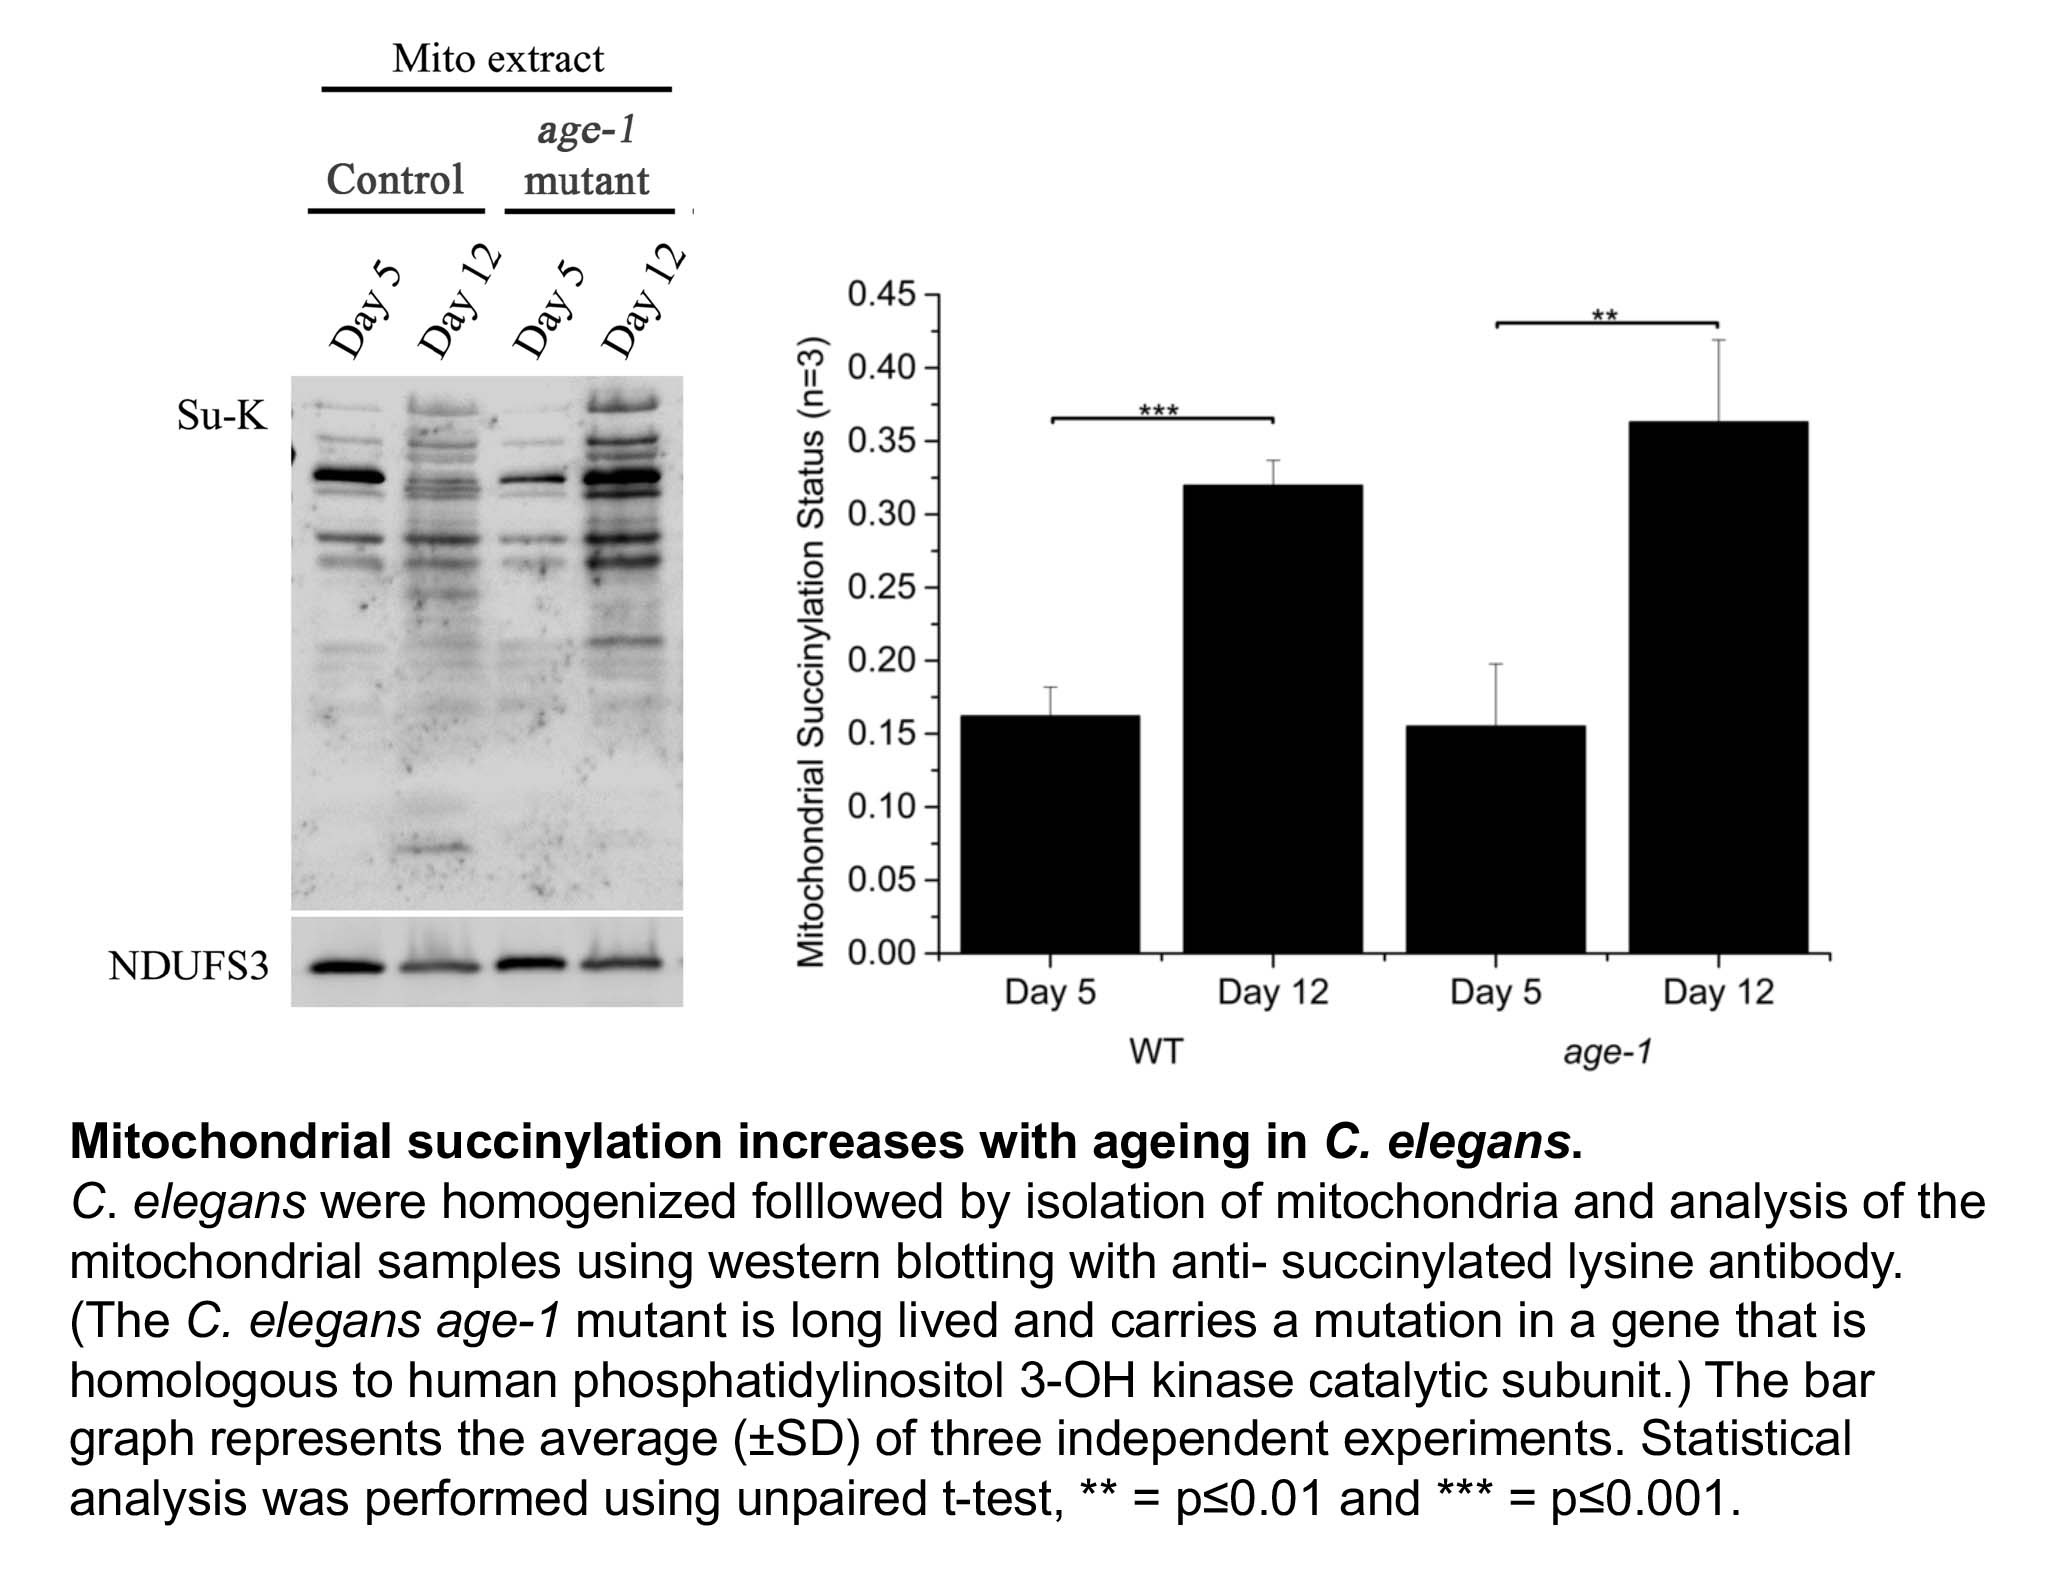
 Otto Warburg, the discoverer of the “Warburg effect”
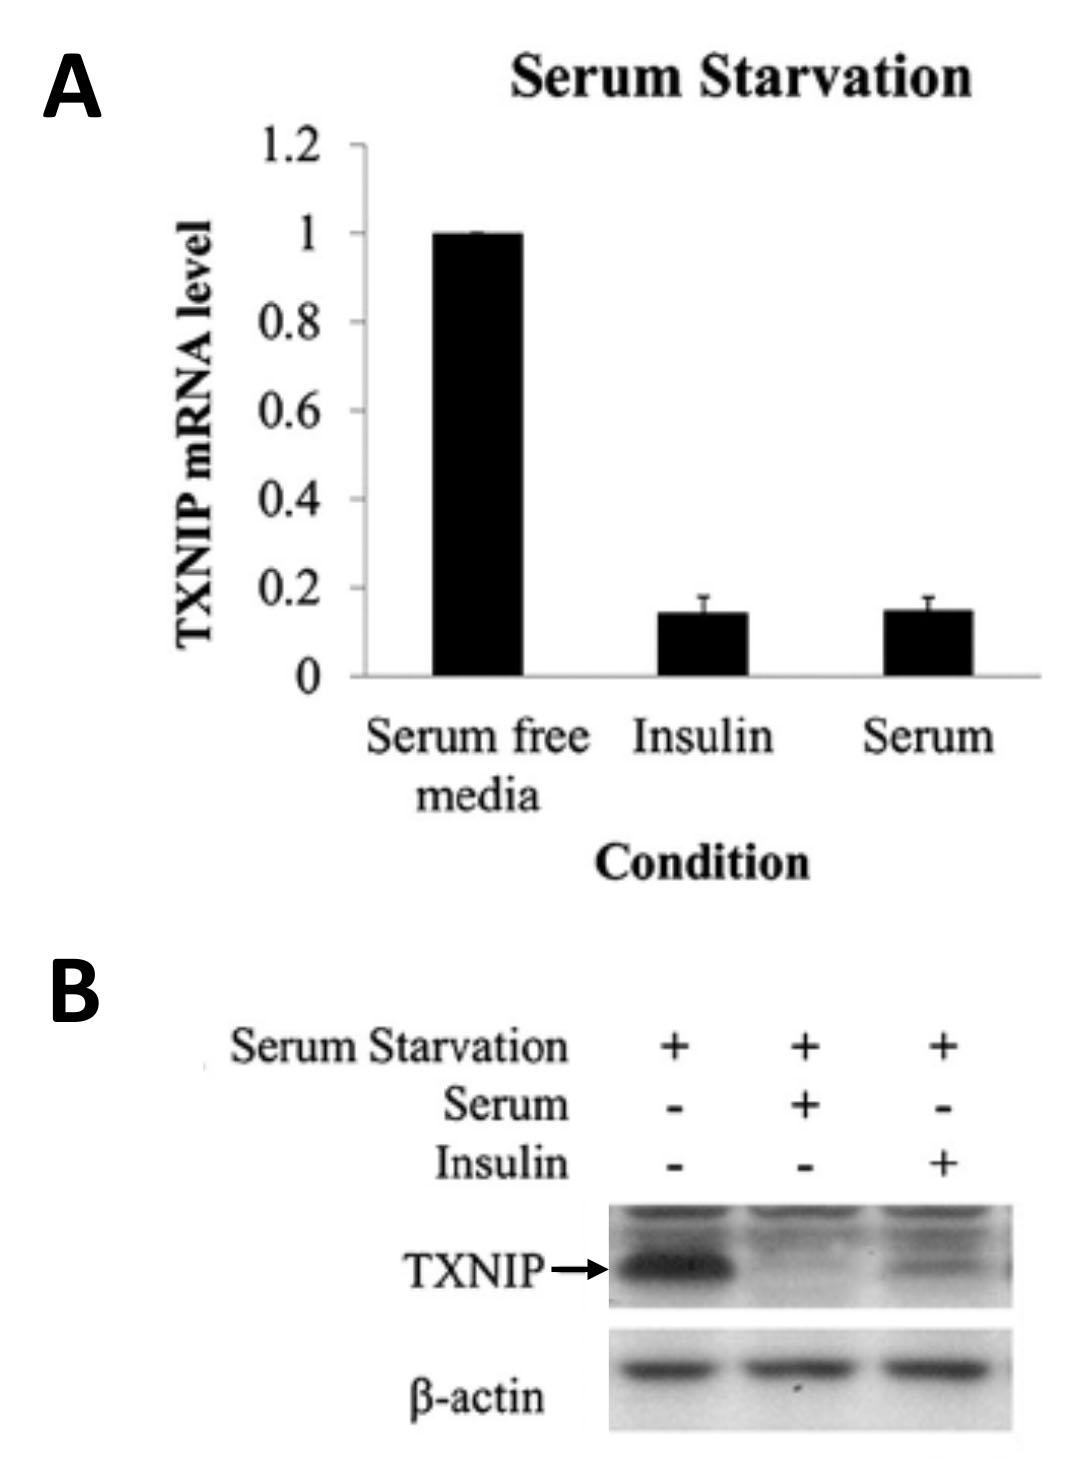
 Inhibition of GAPDH or Aldolase enzyme activity prevents the TXNIP downregulation induced by metformin. (A) HeLa cells were preincubated with 0.5 mM iodoacetate for 10 min followed by 4 h incubation in the presence of 2 mM metformin. Txnip mRNA level was measured using quantitative Real-Time-PCR. (B) Aldolase expression was suppressed using aldolase siRNA. After incubation for 3 days, 2 mM of metformin was added and cells were incubated for 4 h followed by mRNA extraction and quantitative RT-PCR.